Overview
Alerts watch your metrics as calls come in and notify you the moment something goes wrong — a metric starts failing, its average drifts away from its baseline, or a numeric value crosses a limit you set. Each alert is attached to one metric, can be scoped with filters, and routes notifications to Slack. Three things make up every alert:- The metric it watches — any metric on your project.
- The alert type — Failure, Trend, Threshold, New failure mode, or Failure mode spike (explained below).
- Where it notifies — a Slack workspace and (optionally) a specific channel.
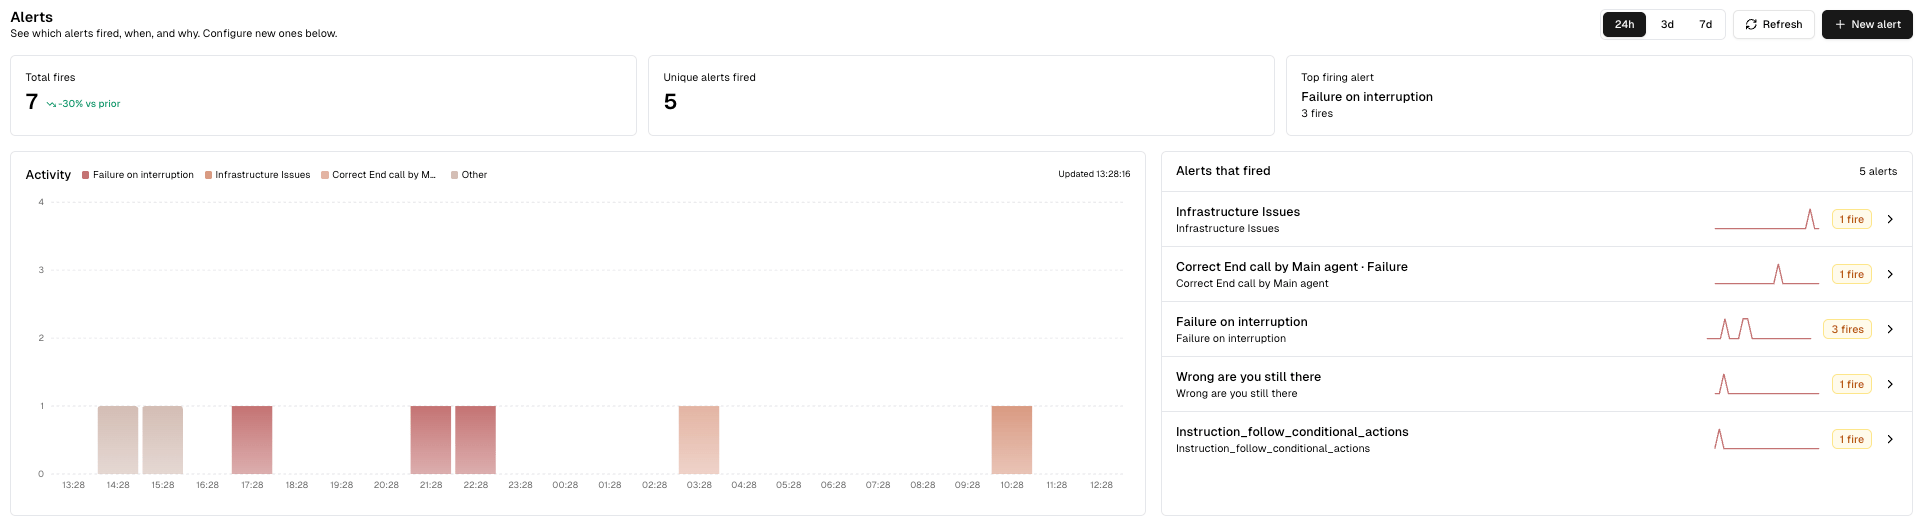
The Alerts page — KPI strip, activity chart, and the alerts that fired.
Alert types
Cekura supports five alert types. The first three watch a metric’s raw evaluations; the last two watch the failure-mode insights Cekura accumulates for a metric (the recurring root-cause categories its failing calls fall into — see Insights). Which types are available depends on the metric you’re watching.Failure alert
Fires immediately every time the metric fails on a call — for example, a binary pass/fail metric scores below passing, or a critical workflow check is violated. There’s nothing to tune: as soon as a failing evaluation lands, the alert fires once for that call. Best for hard failures you always want to know about right away — critical deviations, infrastructure issues, or a workflow step the agent must never skip.Trend alert
Fires when the metric drifts significantly from its recent history. Instead of reacting to a single call, a trend alert maintains a rolling window of recent values and compares new calls against that baseline using an exponentially weighted moving average (EWMA). When the metric moves further than expected, the alert fires. This is the right choice when no single call is “wrong,” but the metric is slowly getting worse (or better) — a satisfaction score sliding down over a few hundred calls, for instance. Trend alerts are tuned with three knobs, but you don’t have to set them by hand. Pick one of the three sensitivity presets:
Under the hood each preset sets three parameters — window size (how many recent
calls form the baseline), a standard-deviation multiplier (how far a value must
move to count as drift), and an EWMA smoothing factor (how quickly the baseline
reacts to recent calls):
A trend alert needs enough history before it can fire — roughly a few full
windows of calls. A freshly created trend alert on a low-traffic metric may stay
quiet for a while as it builds its baseline.
- Both (default) — fire on any significant change.
- Increase only — fire only when the pass rate climbs.
- Decrease only — fire only when the pass rate drops.
Threshold alert
Fires when a numeric metric crosses a value you set. Available for numeric metrics only (e.g. latency, words-per-minute, a 0–100 score). You configure:- Condition — one of:
- Value > threshold — fire when the value goes above a number.
- Value < threshold — fire when the value drops below a number.
- Outside [low, high] — fire when the value falls outside a band.
- Threshold value — the number (or the low/high pair for Outside).
- Min breaches — how many of the recent calls must cross the threshold
before the alert fires.
1means “fire on any single breach.” - Window size — how many recent evaluations to look at (default
50).
New failure mode alert
Fires when Cekura detects a brand-new failure mode for the metric — a recurring failure category it hasn’t seen before. As failing calls are analyzed, each is grouped into a root-cause category; when a genuinely new category appears, this alert tells you a new kind of problem has started happening, before it becomes common. You configure one option:- Minimum calls before firing — how many calls a new failure mode must
accumulate before the alert fires (default
1, i.e. fire the moment it appears). Raise it to suppress one-off blips and only hear about modes that are actually recurring.
Failure mode spike alert
Fires when an existing failure mode’s volume suddenly spikes relative to its own recent history. Unlike a new-mode alert, this watches modes you already know about and tells you when one of them starts happening far more often than usual. Like trend alerts, you tune it by picking a sensitivity preset rather than setting knobs by hand:
Each preset bundles a recent window, a trailing baseline window, a minimum
count, and a spike multiplier. A mode fires when, within the recent window, it
accumulated at least the minimum number of calls and that count is at least
the multiplier times what its trailing baseline rate would predict:
A failure mode with no prior history is treated as a new mode (handled by
the New failure mode alert), not a spike — so the two alert types don’t
double-notify for the same freshly-appeared mode.
Creating an alert
- Open Alerts from the sidebar.
- Click New alert.
- Select a metric. The alert name auto-fills from the metric and type — you can edit it freely.
- Pick the alert type. The available types depend on the metric:
- Failure — no extra configuration.
- Trend — pick a sensitivity preset (and a direction for binary metrics).
- Threshold — set the condition, value, min breaches, and window size.
- New failure mode — optionally set the minimum calls before firing.
- Failure mode spike — pick a sensitivity preset.
- (Optional) Choose Slack delivery. Select a connected workspace, and optionally a channel ID. Leave the channel blank to use the workspace’s default channel. Choose No Slack delivery to create the alert without notifications.
- Click Create alert.
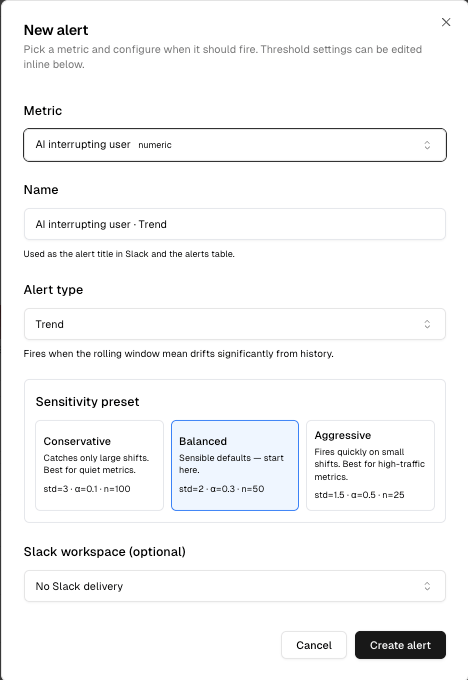
Creating a Trend alert — choose the metric, type, sensitivity preset, and Slack delivery.
Filters (optional)
Every alert type can be scoped with filters so it only considers a subset of calls — for example, only calls for a specific agent, region, or customer segment. Filters use the same JSON query structure as dashboard widgets. Set them from the Filter column in the configured-alerts table.Managing alerts
The All configured alerts table lists every alert on the project. Most columns are editable inline, so you can adjust an alert without leaving the page:
Use the search box and the Agent and Metric Type filters at the top of
the table to narrow a long list.
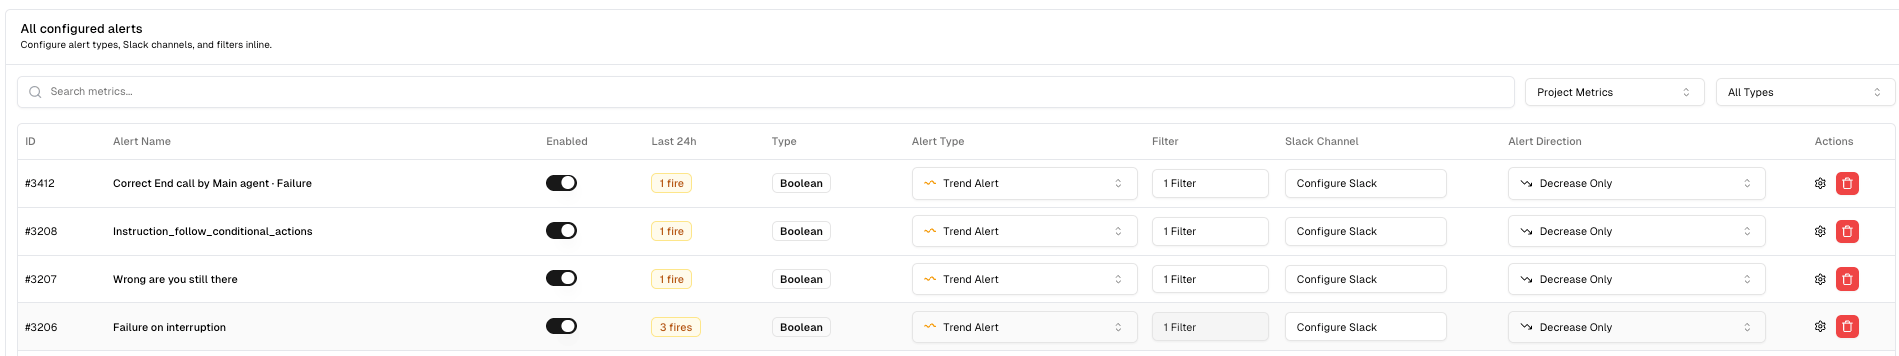
The configured-alerts table — toggle, retype, filter, and route alerts inline.
Slack notifications
When an alert fires, Cekura posts a message to the Slack channel you configured. The message is intentionally compact:- The agent the call belongs to.
- A headline — the metric name, plus the failure or the drift delta (e.g. “Failures went from 12% → 31%”).
- For trend alerts, a trend chart is attached as a follow-up image so you can see the shift at a glance.
- For failure-mode alerts (new mode / spike), the failure mode and its call count, with a View insights button that opens the metric’s failure-mode breakdown.
- Go to call — jumps straight to the call log that triggered the fire.
- Open in Cekura — opens the Alert Review page for the full picture.
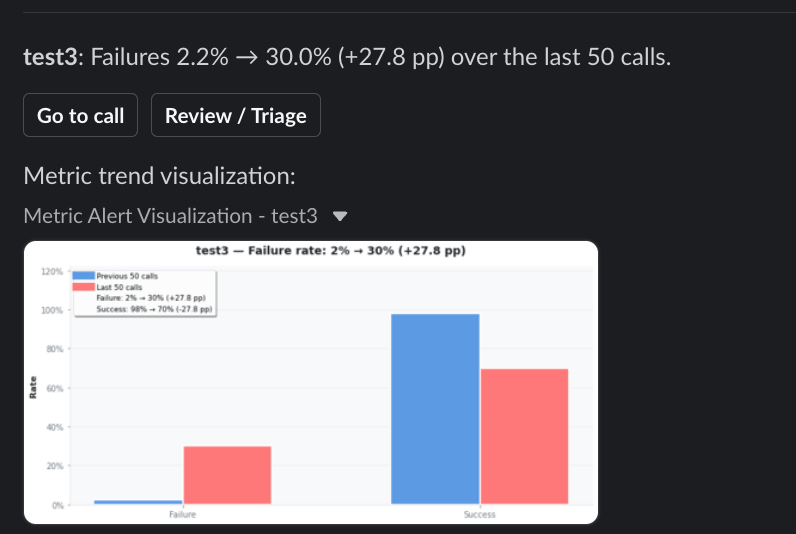
A fired alert in Slack — headline, delta, trend chart, and quick-jump buttons.
Connecting Slack and routing
- Connect a Slack workspace from your workspace settings before you can route alerts to it.
- An alert with a workspace and channel posts to that channel.
- An alert with a workspace only posts to the workspace’s default channel.
- An alert with no Slack config is silent — it still records fires you can see on the review page, but sends no notification.
Calls that fail because of an internal Cekura platform error (rather than a real
agent failure) do not fire alerts — this keeps your channels free of noise
that isn’t about your agent’s behavior.
Reviewing alerts
The Alert Review experience answers “what fired, when, and why” — both across the whole project and for a single alert.Project overview
The main Alerts page summarizes recent activity over a window you choose (24h, 3d, or 7d):- Total fires, unique alerts fired, and the top firing alert as KPI cards, each with a comparison against the prior period.
- An activity chart — a stacked bar chart of fires over time, broken down by the noisiest alerts. Click a bar to filter the list to that time bucket.
- Alerts that fired — a ranked list with each alert’s fire count and a sparkline; click through to its detail page.
Single-alert detail
Open any alert to see its dedicated review page (/alerts/review/{alert_id}):
- KPI cards — fires in the window, when it first and last fired, and current status.
- AI Summary — click Summarize with AI to have Cekura read the recent fires and surface the common theme behind them (headline + themes). Generated on demand and cached.
- Activity chart — fires over time for this alert; click a bar to filter.
- Fire events — a paginated list of every fire, each linking to the call that triggered it. Click a fire to open the call detail inline and step through the fires one by one.
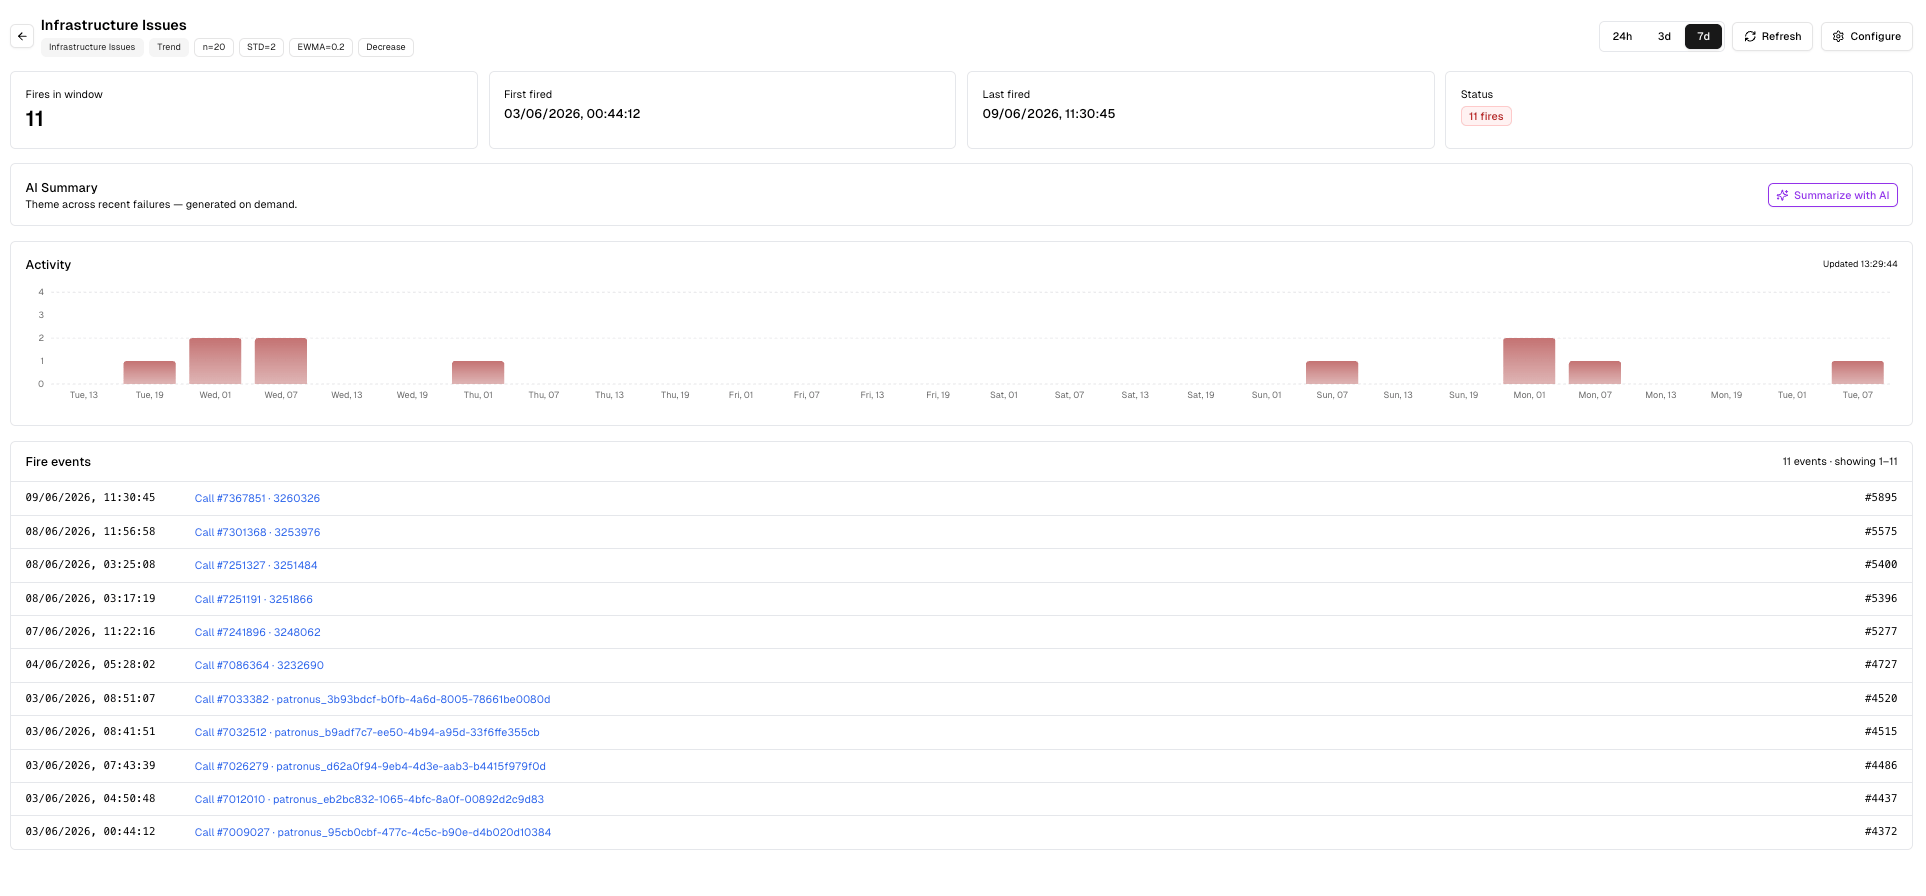
The single-alert review page — KPIs, AI summary, activity chart, and the full fire list.
Managing alerts via the API
Alerts can be created, listed, updated, and deleted through the API (and are available as MCP tools). The key fields on an alert are:project— the project the alert belongs to.name— display name.source_type—"metric".source_id— the metric ID being watched.source— keyed onsub_type:- Failure:
{ "sub_type": "normal" } - Trend:
{ "sub_type": "significant_change", "window_size": 50 } - Threshold:
{ "sub_type": "threshold", "window_size": 50 } - Add an optional
"filters"object to scope the alert.
- Failure:
threshold— config matching thesub_type:- Failure:
{} - Trend:
{ "std_multiplier": 2.0, "ewma_alpha": 0.3, "direction": "" } - Threshold:
{ "operator": "gt", "value": 500, "min_breaches": 1 }(use"value": { "low": 20, "high": 80 }with"operator": "outside")
- Failure:
notifications—{ "slack": { "workspace_id": 123, "channel_id": "C0123" } }. Omitchannel_idfor the workspace default, or omitnotificationsentirely for a silent alert.