Using a coding agent? Paste this prompt directly in your LiveKit agent codebase to jumpstart your Cekura integration.
Overview
LiveKit Tracing provides deep observability into your LiveKit agent’s performance by integrating the Cekura SDK directly into your agent code. This integration significantly enhances the information available in the Cekura platform for end-to-end visibility over agent execution. What you get:- Complete conversation transcripts with full message history
- Tool/function calls with inputs and outputs
- Detailed performance metrics (STT, TTS, LLM, End-of-Utterance)
- Session logs captured automatically from your application
- Mock tools support for testing with predictable tool responses
- Dual-channel audio recording for monitoring production calls
- LiveKit job and room metadata
Video Tutorial
Prerequisites
- A Cekura account with an API key
- A LiveKit agent project
Setup
- Testing
- Observability
Use this setup in your test agents while running simulation calls from the Cekura platform.
Integrate the SDK in your LiveKit agent
Add the Cekura tracer to your LiveKit agent’s entrypoint:What this does:
- Python
- JavaScript
- Captures transcripts, tool calls, metrics, and session logs
- Automatically injects mock tools configured in Cekura
- Automatically configures chat/text mode when running text-based tests
- Exports data to Cekura for test analysis
Configure LiveKit provider and enable tracing
Navigate to your agent settings in the Cekura dashboard, select LiveKit as the provider, and enable tracing: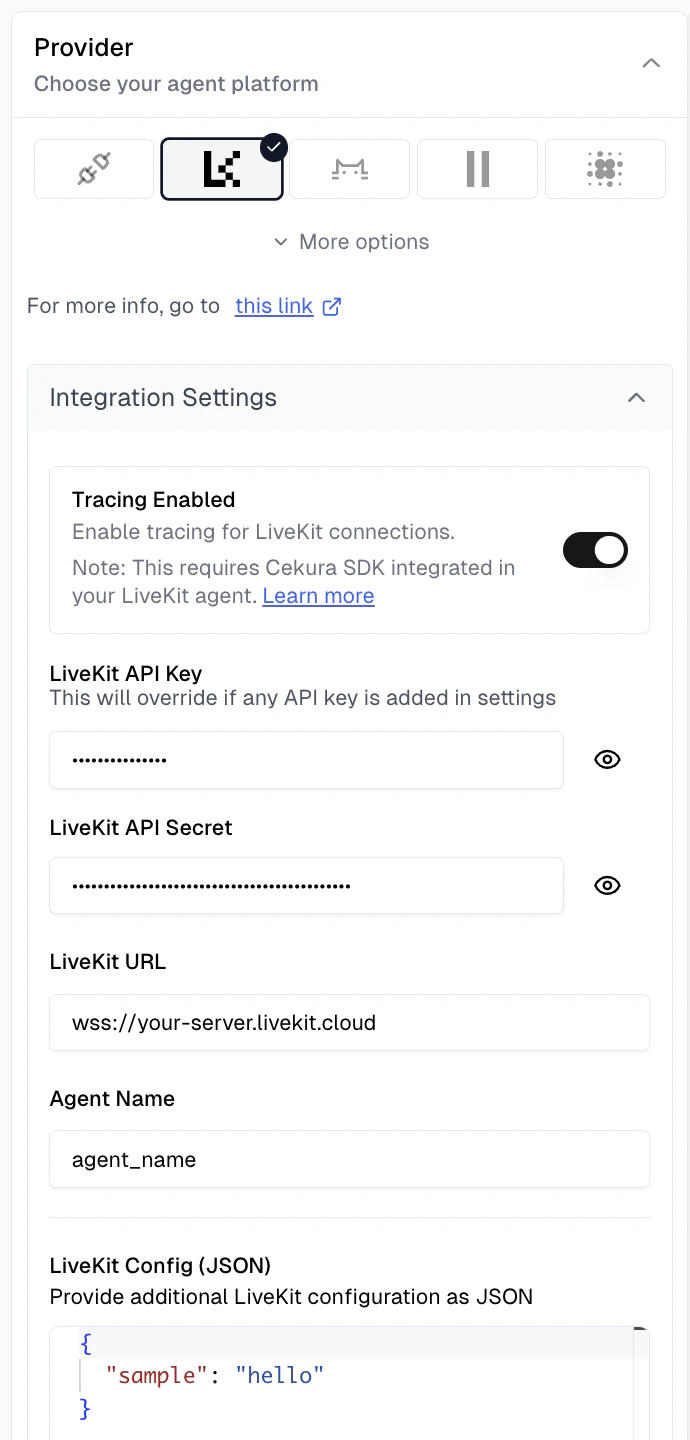
- LiveKit API Key: Your LiveKit API key
- LiveKit API Secret: Your LiveKit API secret
- LiveKit URL: Your LiveKit server URL (e.g.,
wss://your-server.livekit.cloud) - Agent Name: The specific agent name to dispatch in LiveKit
- LiveKit Config (JSON): Additional room configuration parameters (accessible in agent code via
get_simulation_data())
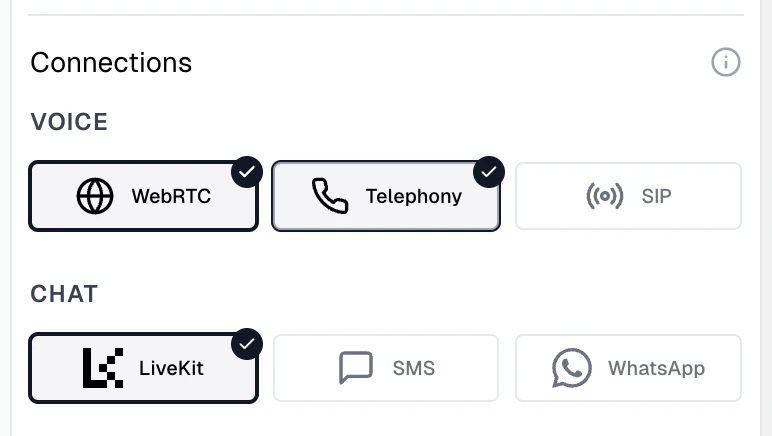
- WebRTC: Direct LiveKit room connection using the credentials configured above
- Telephony: Phone-based testing if your LiveKit agent is connected to a phone system (requires Contact Number)
- Chat: Select LiveKit to enable chat-based testing (uses the same WebRTC configuration, no additional setup required)
Run tests
Run tests using your preferred connection type: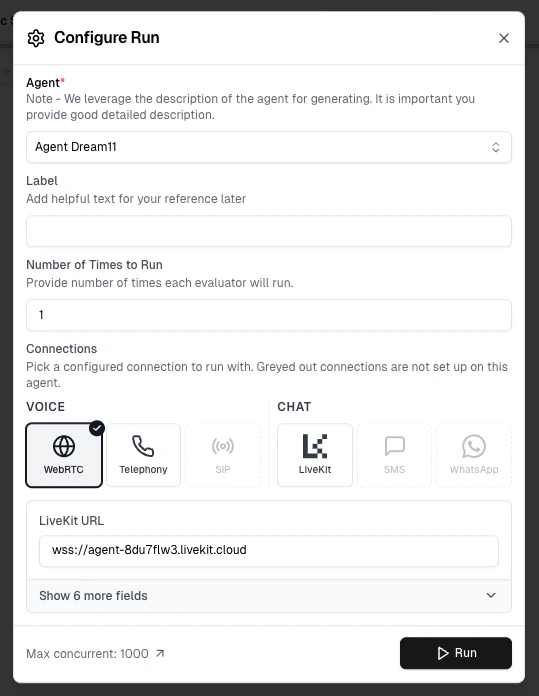
- WebRTC: Select WebRTC under Voice connections in the Configure Run dialog for WebRTC-based testing
- Telephony: Select Telephony under Voice connections for phone-based testing
- Chat: Select a chat connection for text-based testing
Enhanced Data in Cekura UI
With tracing enabled, you’ll see enriched information in the Cekura platform: The run now displays:- Room Session ID: Visible in the call provider ID field, allowing you to correlate Cekura test runs with specific LiveKit sessions
- Complete Transcript: Full conversation history from the LiveKit agent, including tool/function call requests and responses
- Provider Call Data: Detailed metadata accessible in the run details, including job information, room configuration, session logs, and raw performance metrics
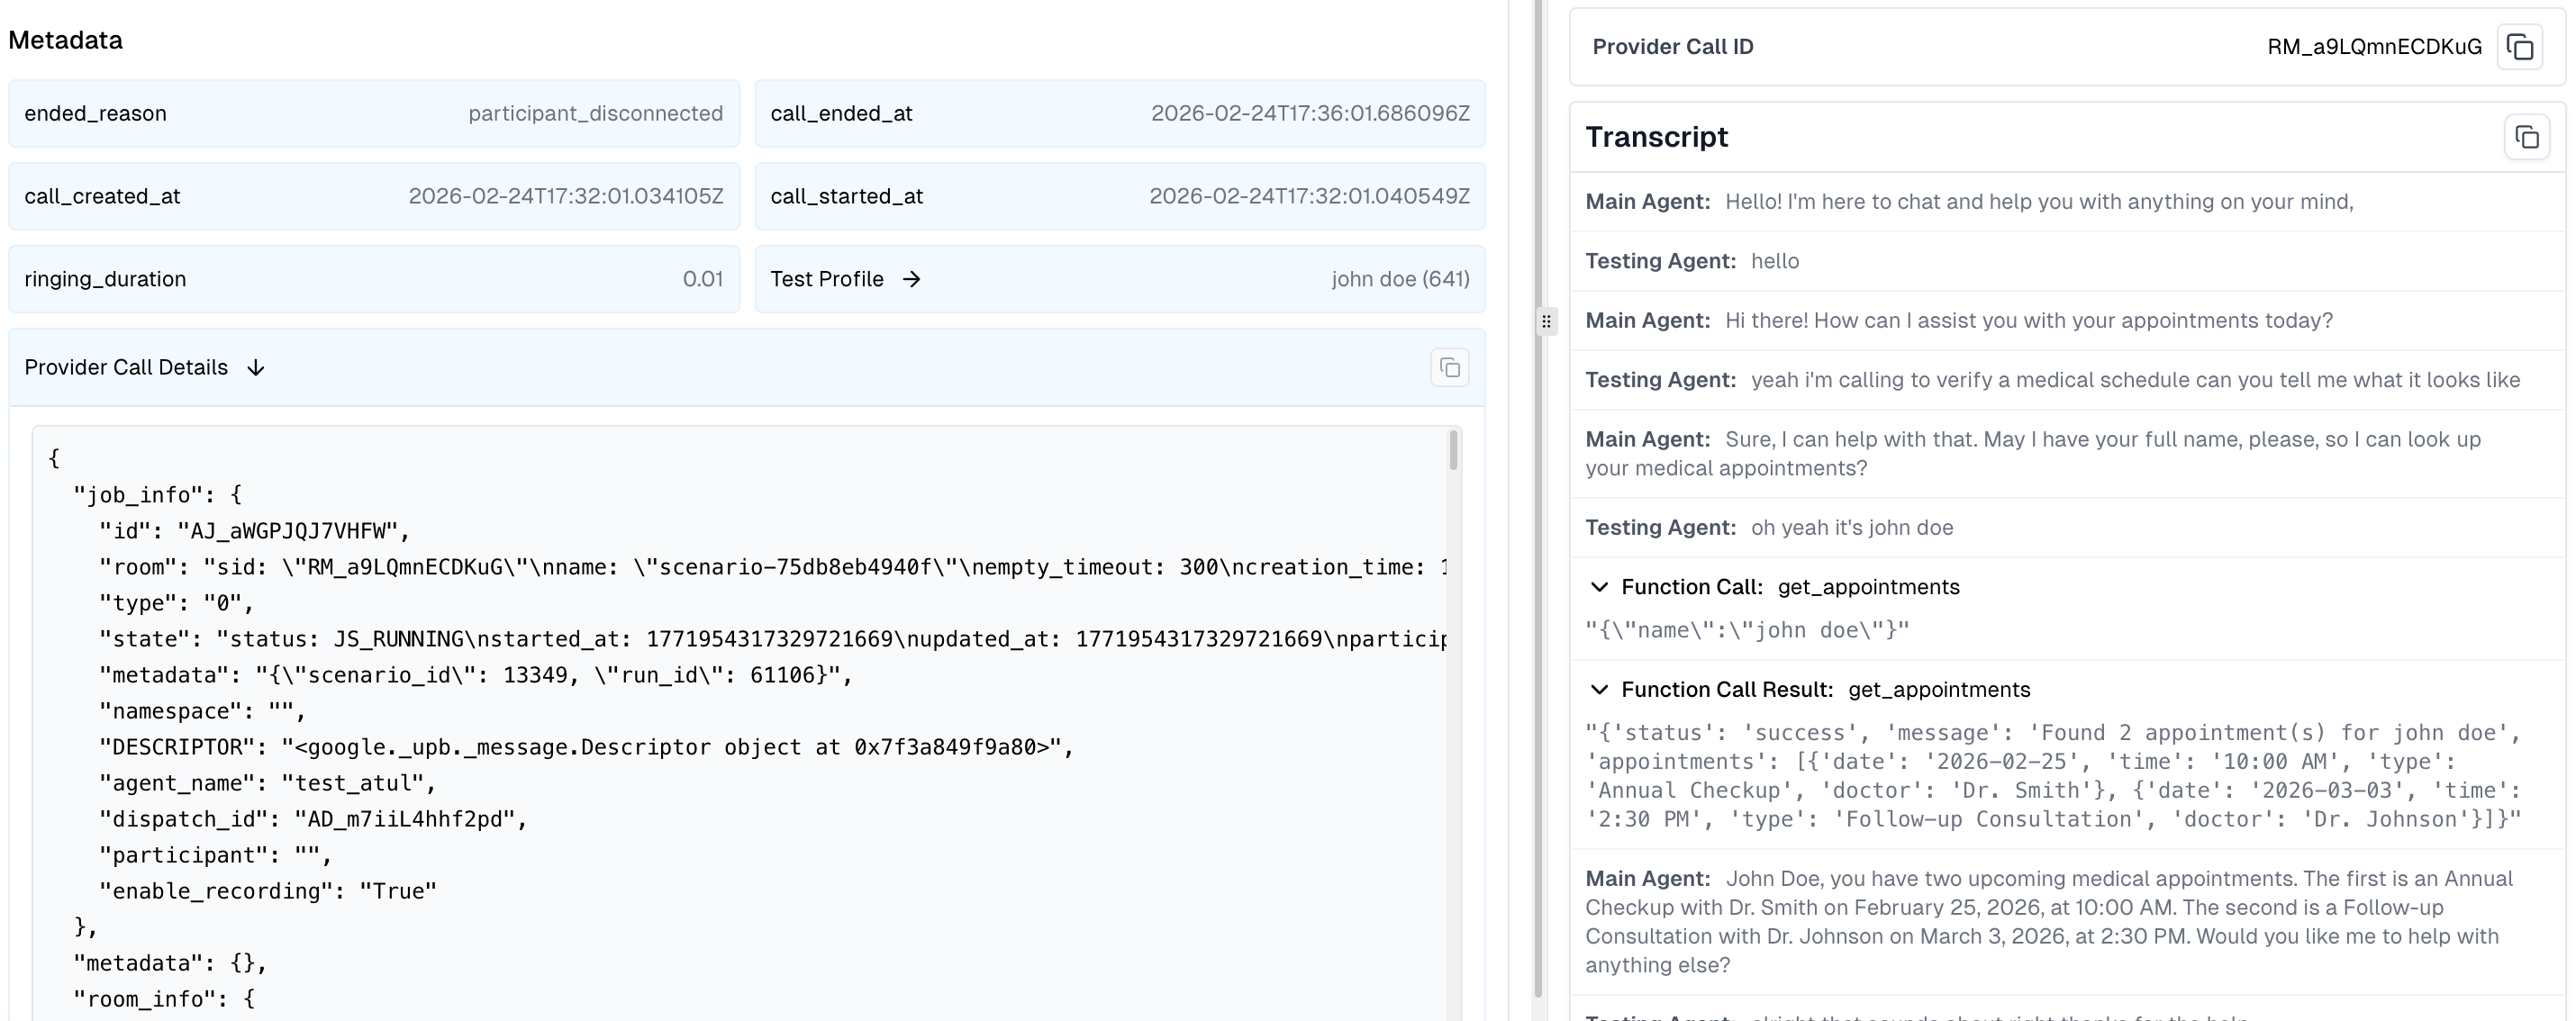
- Job Information: Job ID, room name, participant details, and agent dispatch metadata
- Room Information: Room configuration, participant count, session duration, and connection details
- Session Logs: Captured agent session logs with timestamps, log levels, and messages for debugging
- Raw Metrics:
- STT (Speech-to-Text): Latency, duration, and transcription timing
- TTS (Text-to-Speech): Generation time and audio synthesis metrics
- LLM: Token usage, response time, and inference latency
- EOU (End-of-Utterance): Detection timing and accuracy
- Custom Metadata: Additional metadata passed to the SDK via the
metadataparameter
Automatic Chat Mode Support
The SDK automatically handles chat/text mode configuration when you run scenarios using “Run with Text” — no code changes required. When you run a text-based test, the SDK automatically patches your session to disable audio processing, enabling pure text-based interactions with your agent. This provides:- Targeted testing of your agent’s conversational logic without audio overhead
- Cost savings by eliminating STT/TTS provider costs and reducing Cekura credit usage
- Faster simulations compared to voice-based tests
track_session() / trackSession() integration works seamlessly for both voice and text modes.
Using Mock Tools with LiveKit Tracing
The SDK supports mock tools, allowing you to test your agent with predictable tool responses. This is useful for creating reproducible test scenarios without relying on live external services. To use mock tools:- Create mock tools in Cekura: Set up your mock tool configurations in the Cekura dashboard. See the Mock Tools guide for detailed instructions.
- SDK handles the rest: Once mock tools are configured, the SDK automatically routes tool calls to Cekura’s mock endpoints during testing - no additional code changes needed.
- Test with predictable data: Your agent will receive the mock responses you configured, making it easy to test specific scenarios and edge cases.
Best Practices
-
Use the right method for your environment: Use
track_session()/trackSession()in your test/UAT environments for simulation testing with mock tools. Useobserve_session()/observeSession()in your production environment for monitoring live calls with audio recording. - Use environment variables for credentials: Don’t hardcode API keys in your code
-
Keep the SDK updated: Periodically upgrade to the latest version for new features.
- Python
- JavaScript
- Review tool calls regularly: Add the predefined metric Tool Call Success to your evaluators
SDK Reference
LiveKitTracer Initialization
- Python
- JavaScript
track_session()
Tracks simulation/test calls with automatic mock tool injection and chat mode support. Collects transcripts, tool calls, session logs, and metrics.- Python
- JavaScript
CEKURA_TRACING_ENABLED="false": Disable tracking entirelyCEKURA_MOCK_TOOLS_ENABLED="false": Disable only mock tool injection
observe_session()
Monitors production calls with dual-channel audio recording. Collects transcripts, tool calls, session logs, and metrics. Requires LiveKit credentials configured in Cekura.- Python
- JavaScript
CEKURA_OBSERVABILITY_ENABLED="false": Disable observability entirely
get_simulation_data()
Extracts simulation data populated by Cekura when running simulation calls from the platform. Returns an empty object for phone-based calls.- Python
- JavaScript
- Python
- JavaScript
This data is ONLY available when using Option 2 (Automated LiveKit Testing) — running tests via WebRTC connection. Phone-based calls (Option 1) will return an empty object.
Next Steps
- Set up mock tools for testing with predictable tool responses
- Create custom metrics to evaluate based on provider call data
- Perform load testing with your LiveKit agent
- Explore predefined metrics